WEM Market Pulse/March 2026 — „Markets Never Lose the War.“ Do they?

„Buy when there’s blood in the streets, even if the blood is your own.“
— Ascribed to Baron Rothschild during 1871 Paris Commune
“I would still hold stocks even if I knew WW III would happen.”
— Warren Buffett, on CNBC, March 14th after annexation of Crimea
Economics textbooks refer to the first and the second ‘oil shocks’ as two rather grave historic periods for the global economy, which were triggered in the Middle East: the 1973 oil exports embargo after the Yom Kippur War and the 1978 — 79 Revolution in Iran, which dethroned then-ruling Shah Mohammad Reza Pahlavi, and marked the beginning of the theocratic rule of the Islamic Republic under Supreme Leader Ayatollah Ruhollah Khomeini.
His successor, Ali Hosseini Khamenei, who ruled in Iran since 1989, was assassinated on Saturday along with a lineup of senior regime leaders by joint air strikes by Israel and the USA. A massive retaliatory barrage of missile and drone attacks ensued across the Persian Gulf region, including many high-profile civilian targets, civilian airports, and many popular tourist destinations, as well as oil and gas infrastructure facilities across the Gulf.
The weekend’s events, hence, raise an important question: To what extent can the weekend’s operation be seen as the final end of the 47 years of the Islamic Republic regime, and — equally importantly — to what extent do they pose risks for the global markets? In this note, we focus on offering important context with regards to the latter, especially as it might concern equity investors.
Markets Never Lose the War
Looking at the most recent major geopolitical events comparable to the current one, one notices a similar pattern: Even when there was an initial decline in the stock markets after the initial shock, the performance eventually recovered.
As the attached infographics (Appendix D) suggest, we speak about the experience from Desert Storm in 1991, the Afghanistan War in 2001, and the Iraq War in 2003. Looking at S&P and Bloomberg data after the end of World War II (Sept 1945), the Korean War (Jul 1953), the Vietnam War (Apr 1975), the Gulf War (Feb 1991), the Iraq War (May 2003), or even the Russia–Ukraine conflict (as of Oct 2022), the average 12-month returns after these major conflicts amounted to 24.90%.
For more information, see Appendix A: Historical Market Drawdowns and Recoveries.
An even more detailed account by Carson Investment Research, which maps all 43 major geopolitical events since the invasion of France in 1940, shows that — one month after their occurrence — the S&P 500 was in the green in only 46% of these external shocks, with a median loss of -0.20%. However, after 6 months, the share of positive returns increases to 61%, and after 12 months, it’s up to 65% with a median return of 7.40%.
Energy Holds the Key
As detrimental as military activity is to the destruction of human lives, the associated defense ramp-up, material reconstruction, and post-war recovery are positive drivers of economic activity. Even though one must be reminded of the broken window paradox — pointing out that destruction diverts economic resources from other, more productive activities — it is recorded as the generation of economic activity (and GDP), though it is not a generation of new wealth for society.
The above account is also consistent with the previously mentioned observation that geopolitical shocks alone tend to have only temporary negative effects on the prevailing trends in the financial markets. Having said that, one must pay attention to the First Oil Shock of 1973, which did have a lasting negative impact on equity returns (after the Yom Kippur War and Oil Embargo). The reason was that oil remained in short supply for an extensive period, leading to a situation called “stagflation” — elevated inflation associated with sluggish economic performance. The economy basically no longer operated efficiently in the 70s.
However, after the Russian invasion of Ukraine caused a massive spike in global energy markets, new supplies came online after 2022, resulting in a less pronounced and less lasting impact of this shock on the global macroeconomy and markets. Hence, the most important question arising is: Which of these two extreme situations are we witnessing in the case of the attack on Iran? It’s not only energy markets, as they still effectively act as a bloodline for the economy — even the AI-driven economy of the future.
Scenarios Affecting (not only Commodity) Markets
As of the fourth day of operations in Iran, the dust of newswires is whirling high, including attacks on EU member Cyprus and Greece dispatching its navy to protect it. Just as important news is in constant flux, so is the scale of possible outcomes for the oil markets, the global macroeconomy, and — ast but not least — for Iran.
The best-case scenario of an early ceasefire, implied by the reference to the “Venezuelan scenario” by the US president, would imply a return of the oil price back to the average before the escalation of geopolitical turmoil and the associated risk premium in the price of oil. An ongoing supportive stance from OPEC, as well as a high volume of oil floating on the seas, creates a conducive environment for such a situation.
On the other extreme, there is the option of an escalating conventional war conflict, associated strikes against oil infrastructure, and the closing of the Strait of Hormuz, resulting in lasting triple-digit oil prices, which would impact both global inflation (up) and growth (down).
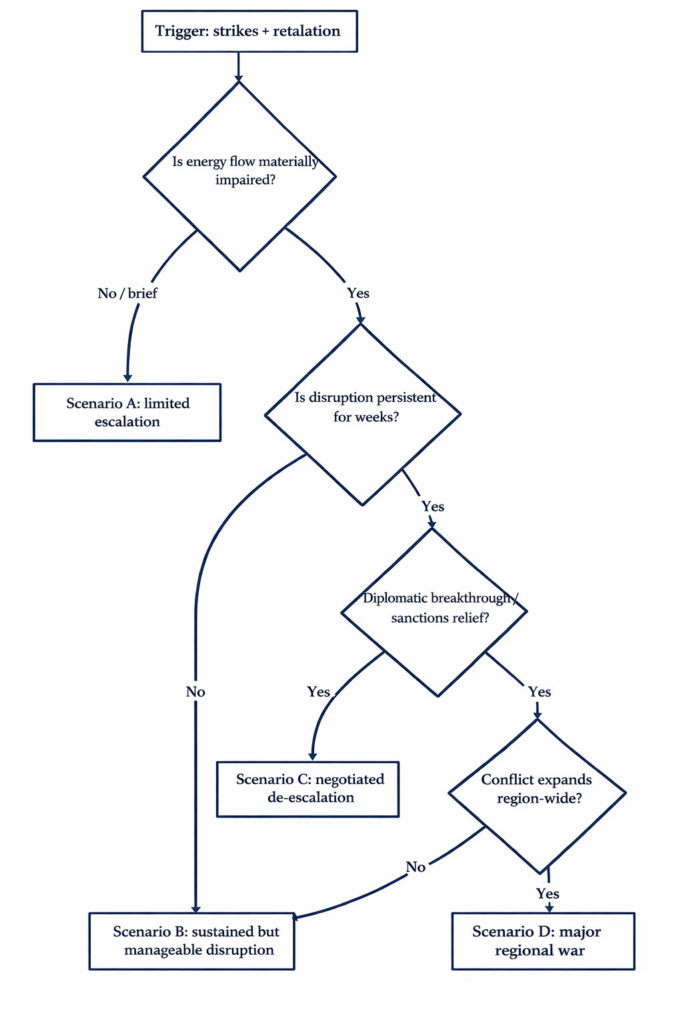
For more information on the various paths forward, see Appendix C: Scenarios Flowchart.
In between is the scenario that may be most desired by the protesters in Iran: i.e., a change of Iranian government, which would also lower the current threats to neighbors in the Gulf and eventually fade the risk premium. Even if this change were not smooth, it would only affect Iranian oil production but spare the region, which continues to supply one-fifth of global oil, as well as the LNG supply. How even the worst-case scenario pans out depends on whether the attacks against neighboring oil facilities and the risk of the closure of the Strait of Hormuz continue — something where China, as well as other Asian clients of Iran, might and increasingly will have a say. Speaking of the most populous countries of the world, which are also major energy importers, it is suitable to mention also the EU, which equally stands to lose from a protracted war.
Derived from the sensitivity of oil prices observed during the 12-day bombing campaign against Iran last year, the worst-case scenario of the total and lasting closure of the Strait corresponds to a spike in the oil price towards and exceeding 120 USD/bl, as briefly seen after the start of the Russian invasion of Ukraine.
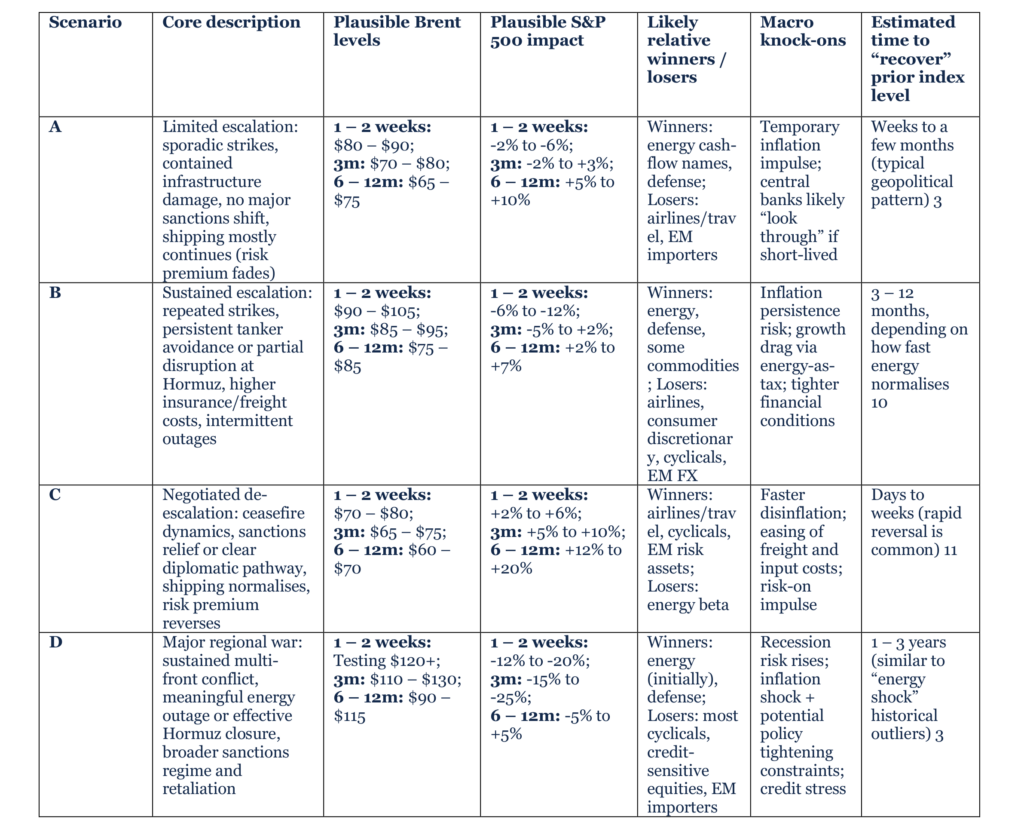
Source: Wealth Effect Management. Values derived from the analysis of historical scenarios and forward-looking estimates.
Investment Implications and Market Recommendations
Rather than making a binary „all-in or all-out“ bet, we recommend an evidence-based approach that focuses on building portfolio robustness across multiple scenarios. This strategy prioritizes incremental rebalancing over liquidation; by buying into equity sell-offs to maintain target weights, investors avoid the significant underperformance that often results from missing rapid market recoveries.
To protect against energy squeezes or sustained inflation, we recommend utilizing layered hedges — such as commodities, defense, and gold — noting that gold remains a historically effective tactical hedge against geopolitical risk. Additionally, while high-quality bonds are a traditional „risk-off“ refuge, we recommend selective quality in fixed income, as inflationary oil shocks can weaken this hedge by driving real yields higher. Ultimately, we recommend treating cash as a source of optionality for liquidity and rebalancing rather than a market-timing tool, as the historical penalty for missing a rebound far outweighs the perceived safety of a panic-driven move to cash.
For more information on our views on equity positioning, please visit Appendix B: Winners and Losers.
Conclusions and Major Risks: Remember US President Sensitivity to Market Performance
„Hope for the best, prepare for the worst“ is the usual advice in similarly tense periods. Sensitivity of the US Administration to the market’s reaction is an additional factor at play. A parallel with the Liberation Day of 2025 might come handy here, as some commentators associate the market drawdown with what effectively was backtracking of the initially threatened scope of tariffs, especially with regars to the biggest corporations with access to the White House.
These considerations will certainly play a role in the current global arena, especially with regard to the crucial US allies in the Gulf, some of whom already voiced their grudges. This would also explain why on Monday, after the attacks, the “Venezuelan” scenario was mentioned again by the US President, along with surprise over the attacks against non-participating neighbors. Which, according to some, was part of the leverage from the Iranian regime.
As for the commodity markets, the geopolitical risks continues to cloud the market developments, as JP Morgan summarised:
„The main risk in our view remains that the regime could lose command and control over the IRGC — as highlighted by the recent attack in Oman — which would introduce a far more unpredictable and destabilizing scenario for regional oil supply and markets. Retaliation from Hezbollah could further amplify these risks. A prolonged escalation — especially if Iran applies economic pressure — could push prices much higher. We estimate that if the conflict lasts more than three weeks, GCC oil producers would exhaust storage capacity and would be forced to shut in production. Under this scenario, Brent could trade in the $100 — $120 range. Given the timeline of these unknowns, we are not making changes to our existing price forecast at this stage.“
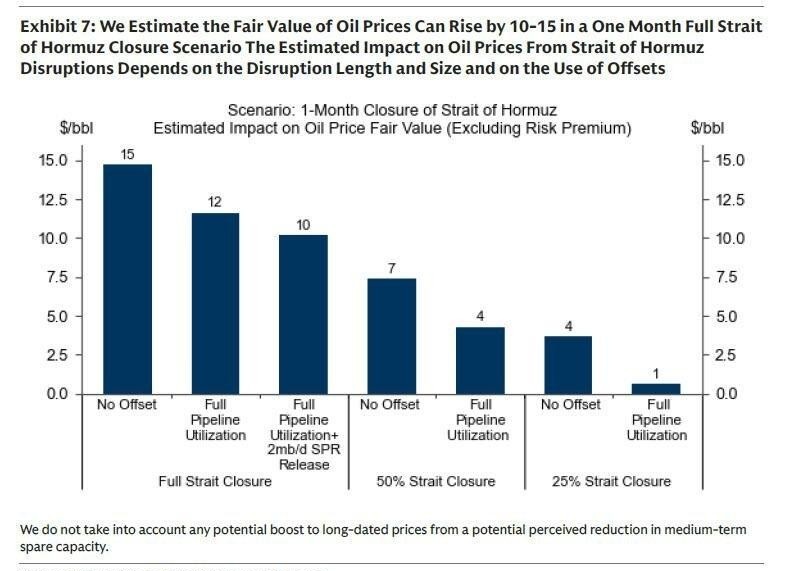
Attached is the chart of the oil price scenarios depending on different developments of the Iran’s operations by Goldman Sachs.
APPENDIX A.: Historical Market Drawdowns and Recoveries
APPENDIX B.: Winners and Losers
China, India and EU as major economies dependent on energy commodity imports stand to lose most in the worst case scenario. At the same time, one should not forget the major roles which industrial policies still play in both the most populous economies of the world and which industrial policy starts to play more decisively in EU — especially with regard to the defense sector (and its nearshoring), dual-use infrastructure and strategic autonomy beyond energy security.
If the higher oil prices were driven by outages of supply, the Persian Gulf countries would stand to face triple negative: oil disruption would add on to the already inflicted losses from tourism and transportation sectors as they stand to face Iranian retaliatory attacks.
Net energy exporters in safe geographies would stand to benefit, among them Norway and Canada (EU allies), as well as Russia.
Among the sectors, winners are defense, North American energy, and cybersecurity stocks. On the other hand, losers come from airlines, cruise lines, and consumer discretionary.
In a prolonged Iran conflict scenario, several sectors stand to benefit from heightened geopolitical tensions. Defense primes such as Lockheed Martin (LMT), RTX Corporation (RTX), Northrop Grumman (NOC), General Dynamics (GD), and Boeing (BA) gain from missile defense deployments, drone warfare adoption, and munitions restocking. North American energy firms, including ExxonMobil (XOM), Chevron (CVX), ConocoPhillips (COP), Valero Energy (VLO), Marathon Petroleum (MPC), Halliburton (HAL), Schlumberger (SLB), Cheniere Energy (LNG), Kinder Morgan (KMI), and Enterprise Products Partners (EPD), capture supply gaps as buyers seek alternatives amid disruptions. Cybersecurity companies, such as CrowdStrike (CRWD), Palo Alto Networks (PANW), Fortinet (FTNT), Zscaler (ZS), and CyberArk (CYBR) are positioned for critical infrastructure protection in an elevated threat environment. Tanker rates spike due to rerouted trade flows, benefiting firms like Frontline (FRO), Scorpio Tankers (STNG), Teekay Tankers (TNK), Euronav (EURN), and DHT Holdings (DHT). Precious metals see safe-haven demand, boosting Newmont Corporation (NEM), Barrick Gold (GOLD), Wheaton Precious Metals (WPM), Franco-Nevada (FNV), and Agnico Eagle Mines (AEM). Actual performance varies with market conditions; this is not financial advice.
Conversely, certain sectors face downside risks in an extended conflict, including inflation, supply chain disruptions, risk-off sentiment, fuel surges, and regional issues. Consumer discretionary and global brands, such as Nike (NKE), Starbucks (SBUX), Lululemon (LULU), VF Corporation (VFC), and Under Armour (UAA) are pressured by these factors. Cruise lines, such as Carnival Corporation (CCL), Royal Caribbean Cruises (RCL), Norwegian Cruise Line Holdings (NCLH), and Viking Holdings (VIK) are exposed to unhedged fuel costs and port disruptions. Airlines, including Delta Air Lines (DAL), United Airlines (UAL), American Airlines (AAL), Southwest Airlines (LUV), and Spirit Airlines (SAVE) contend with fuel cost surges and route suspensions. Travel and online travel agencies (OTAs), like Booking Holdings (BKNG), Expedia Group (EXPE), Airbnb (ABNB), TripAdvisor (TRIP), and Trip.com Group (TCOM) are vulnerable to discretionary demand pullbacks and regional booking collapses.
APPENDIX C.: Scenarios Flowchart
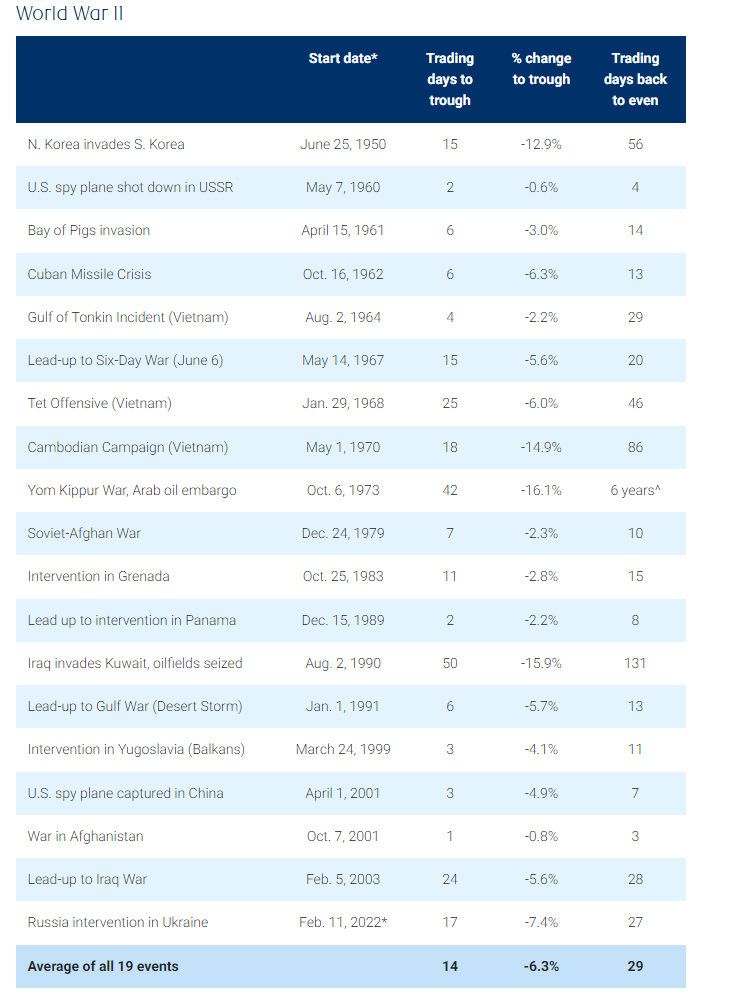
APPENDIX D.: US Stock Market Response to Previous Middle East Wars
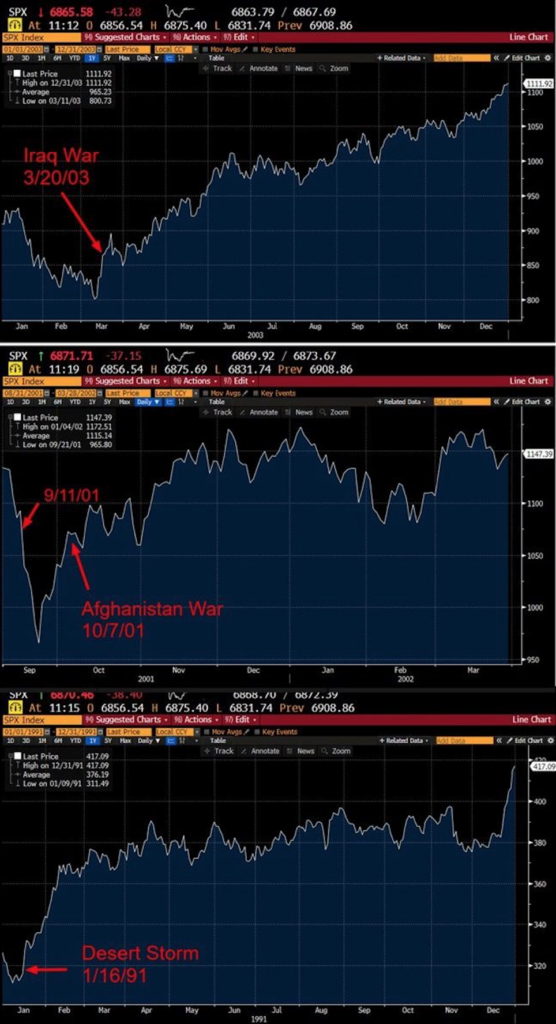
Source: Wealth Effect Management; Chart sourced from the Bloomberg Professional Terminal.
APPENDIX E.: US Stock Market Performance after Major Geopolitical Events
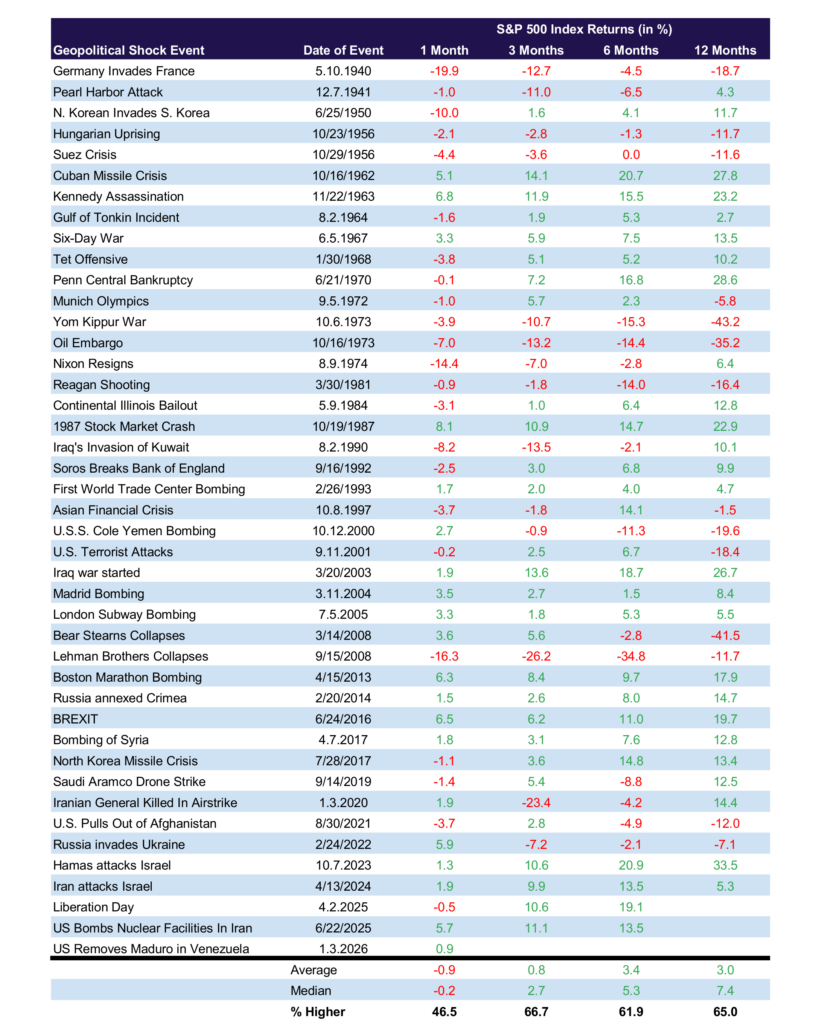
Source: S&P Dow Jones Indices, CFSA, Strategas, Carson.
Afterall, how this situation panes out will depend on the intensity, but most importantly on duration of the current escalation of hostilities.

Portfolio Manager & Investment Strategist

Portfolio Manager

Chief Economist

